Live benchmarking to spot top and underperforming sites before it costs you.

Actionable trends and strategies for hospitality leaders.
Discover new tools for faster, clearer reporting.

Methods to boost efficiency and profit group-wide.
Automated reports highlight issues before they escalate.
Motivate teams with real-time performance rankings.
Send benchmarking packs to your team in seconds.
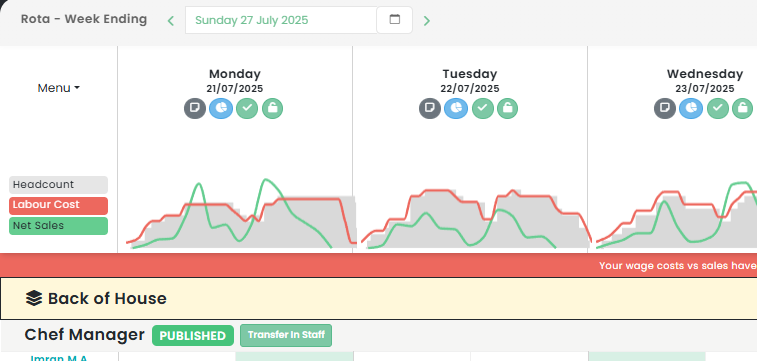
Review rotas, invoices, and notes for each location.
Track daily, weekly, or monthly results easily.
View sales, labour %, GP, and more per site.

“Instant benchmarking revealed performance gaps across our sites. We acted fast, focused our team, and shared clear, actionable data.”
Clear, direct answers for multi-site operators and finance teams.
Benchmark unlimited locations—no cap on site count. Built for multi-site groups.
Yes. Custom dashboards for managers, directors, or finance—see only what matters.
No. Data syncs automatically from rotas, invoices, and POS for up-to-date insights.
Track labour %, net sales, GP, stock, rota efficiency, and more. All key KPIs included.
Data updates daily for near real-time performance and trend visibility.
Yes. Download or schedule weekly benchmarking packs for ops and finance teams.
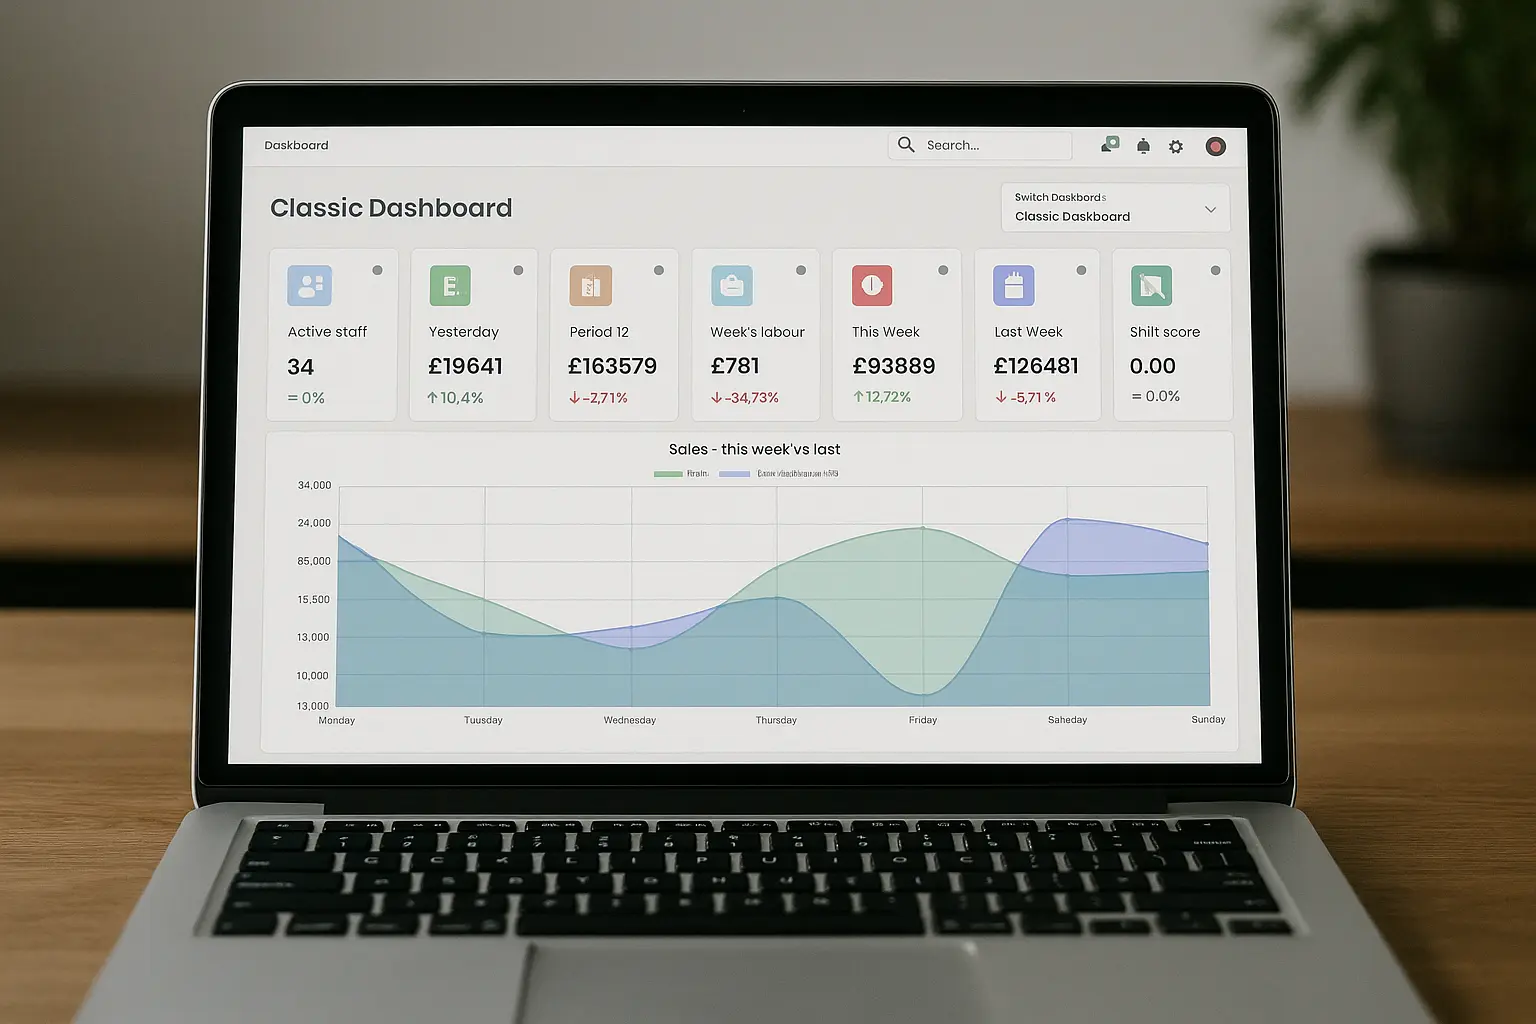
See sales, labour %, and GP at a glance. Identify top and underperformers with real-time data.
AI-powered alerts highlight issues before they impact your bottom line. Make informed, strategic decisions.
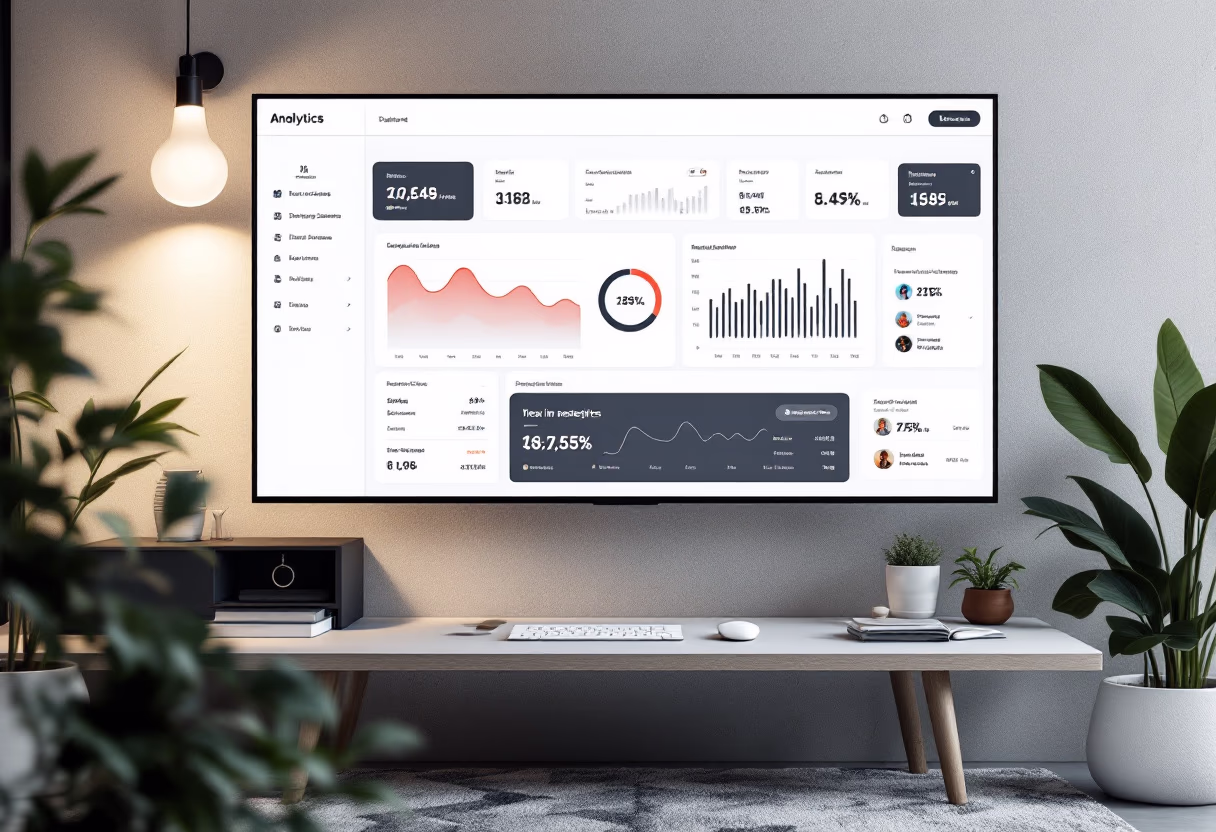
Instantly see how each location stacks up. Identify top performers, spot underperformance, and drive results with real-time data.
Get side-by-side comparisons on sales, labour %, and GP. Make informed decisions—no more guesswork.
AI variance alerts highlight cost drifts and inefficiencies, so you can act before they impact your bottom line.
Monitor every site from one dashboard. Export reports, drill down into details, and benchmark with confidence.
Instantly compare sales, labour %, and GP across all your locations. Spot trends and outliers at a glance.
Rank sites by profitability, efficiency, or sales. Click into any site for detailed rotas, invoices, and notes.
Instantly compare sales, labour %, and GP across all locations. Spot trends and outliers at a glance.

Get automatic alerts for underperformance. Address issues before they impact your bottom line.

Rank sites by profitability and efficiency. Click into any site for detailed performance insights.
Weekly benchmarking packs sent to ops and finance leads. Share actionable data with your team.
![[background image] image of an inviting urban street near the restaurant](https://opsytehomepage-a2cpdjfmbkc9afa3.uksouth-01.azurewebsites.net/images/a79e14d7-52da-4934-a705-5d8a2348de3b.avif)
Exploring QSR Franchise Opportunities in the UK Hospitality SectorThe United Kingdom's hospitality sector boasts a diverse landscape of businesses, with one of the most significant being the Quick Service Restaurant…...
Unveiling Successful QSR Examples in the UK Hospitality SectorIn the UK hospitality industry, Quick Service Restaurants (QSRs), commonly known as fast-food establishments, have proven to be an influential sector. This…...
Promotion Ideas for Bars: Tactics for Boosting Business and Attracting CustomersRunning a successful bar is not just about serving top-notch drinks, it's also about creating an atmosphere that keeps customers…...
Revolutionising Restaurant Management: The Rise of Invoice Software in the UK Hospitality IndustryThe UK hospitality industry is a dynamic sector, and within its sphere, the restaurant business is a key…...
Embracing QSR Software for Enhanced Restaurant ManagementIn today's technologically advanced era, the UK hospitality sector, particularly quick service restaurants (QSRs), are increasingly adopting QSR Software and Restaurant Management solutions. Th...
Opening a quick-service restaurant (QSR) is a blast, but it’s not always easy. You’ve got menus to plan, customers to serve, and a budget to stick to, all while keeping…...